Tour
See exactly what your clients see
These are real screens from the dashboard, shown with a sample business. Every screen is built to answer one question: what did the marketing do?
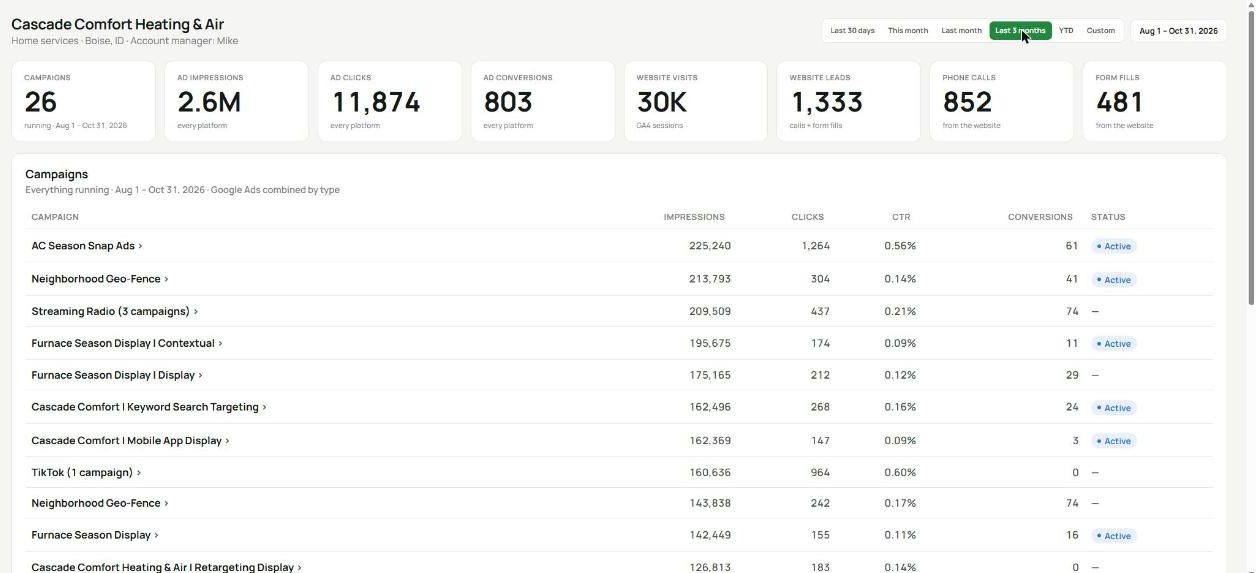
The Overview: the whole picture on one screen
Every campaign on every platform, side by side, for any date range. Ad results at the top, website visits, calls and form fills right next to them.
- Every campaign that ran, on any platform, in one list
- Ad results and website leads on the same screen
- Pick any date range; every number follows it
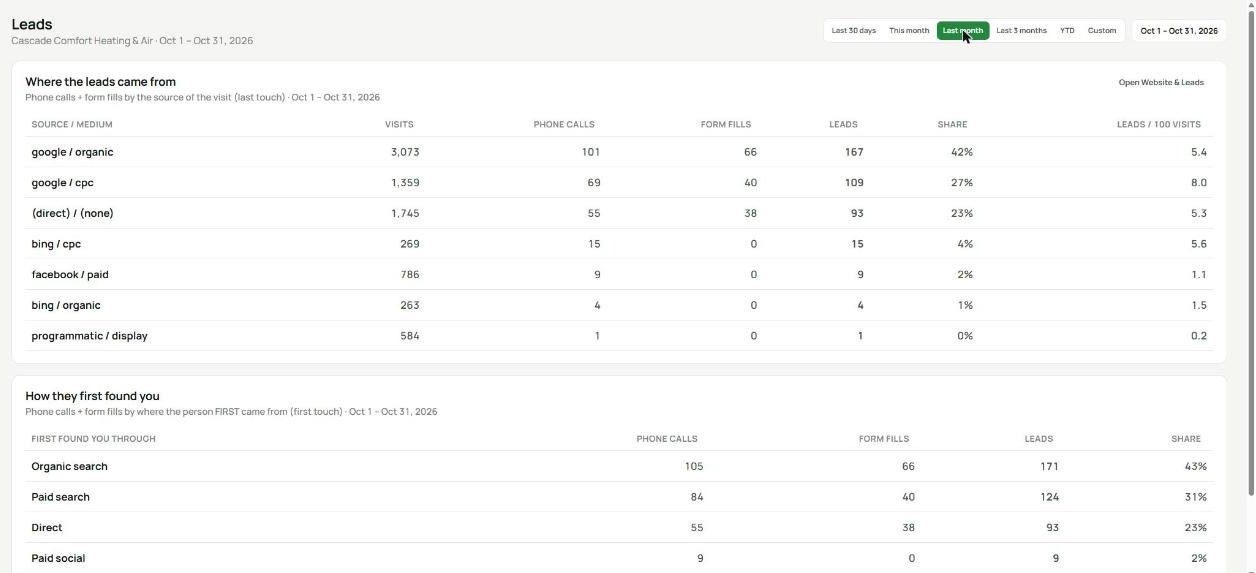
Leads: where your customers actually came from
Phone calls and form fills from the website, broken down by where each visitor came from, plus how they first found you. This is the screen that answers "is it working?"
- Calls and forms, not just clicks
- Last touch and first touch, side by side
- Leads per 100 visits for every source
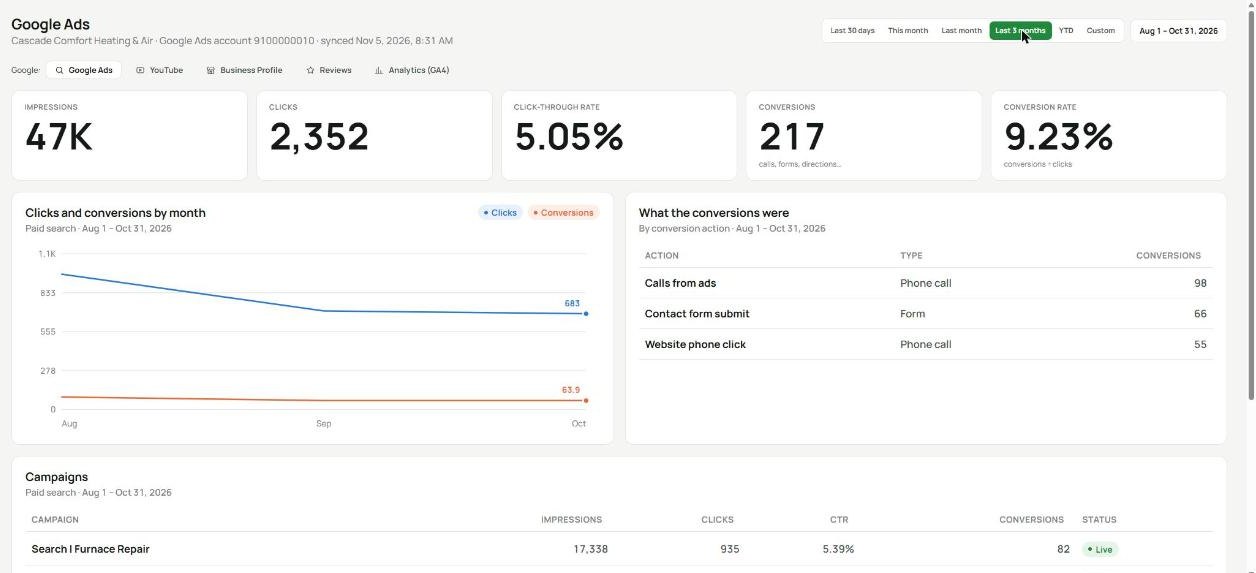
Google Ads: what the clicks turned into
Clicks, conversions and conversion rate, plus exactly which actions counted: calls from ads, website phone clicks, form submissions.
- Every conversion named, so nothing is a mystery
- Campaign-by-campaign results
- YouTube, Business Profile, reviews and Analytics one tap away
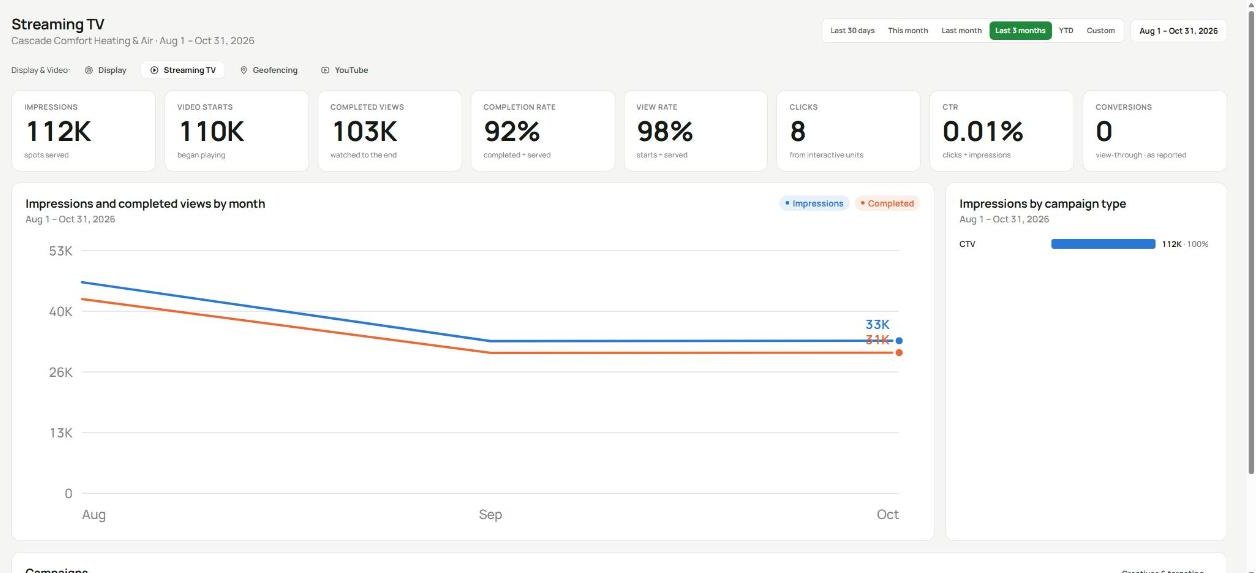
Streaming TV: proof the ad was watched
Streaming TV is easy to buy and hard to measure. Here every spot is counted: how many played, how many were watched to the end, and the completion rate.
- Completed views and completion rate
- Month-by-month delivery
- Display, geo-fencing and YouTube on the same page
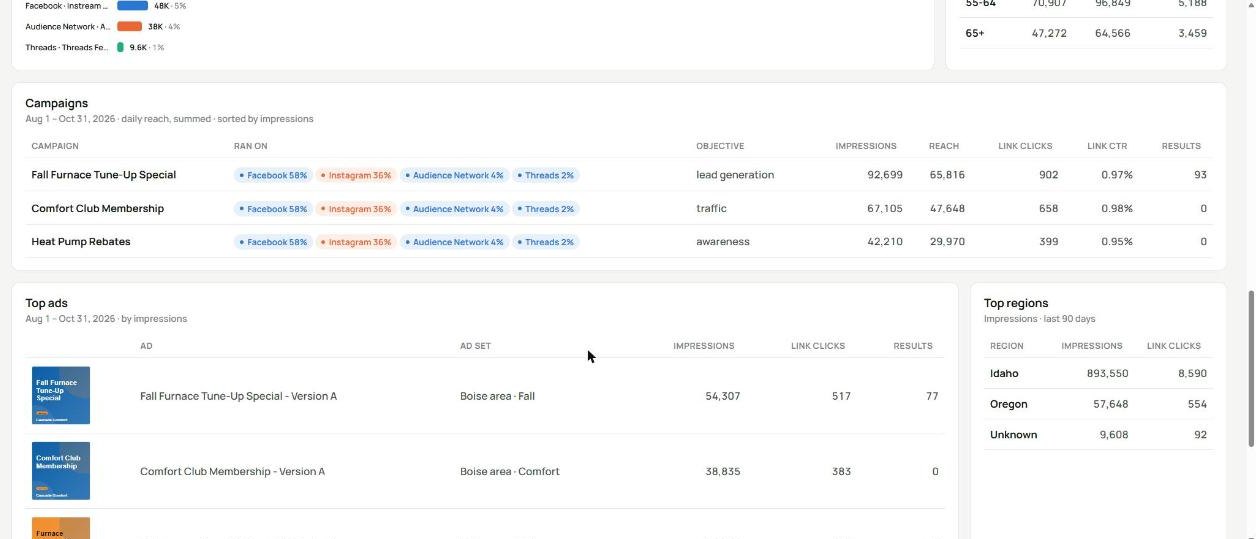
Facebook and Instagram: the ads themselves
See the actual ads next to their results: which creative was shown most, which drove clicks, and which brought in leads. Plus where the ads ran and who saw them.
- Every ad with its picture and its results
- Placements, age, gender and region
- Lead results kept separate from awareness
Built for success
Numbers you can trust, shown so anyone can understand them
A report only helps if people believe it and can read it in a minute. Every part of Mike's Metrics is built around those two things.
Counted once, never twice
When several platforms report on the same campaign, results are merged so nothing is double counted. Website leads and ad conversions are kept separate, never added together.
Exact by day, exact by month
Every number is stored by day, so any date range adds up precisely, and monthly totals match what you bill and what co-op programs require.
Results first, jargon last
Calls, form fills, bookings and completed views come first. Clients see what their money did in plain words, on any phone.
The right people see the right numbers
Each client sees only their own business. Costs, margins and partner names stay with the agency unless you decide to share them.
Click around the real thing
The live demo has every screen, including reviews, rankings, streaming audio and the printable report.